air apocalypse
India’s air kills on the scale that tobacco killed in the twentieth century. The response has mostly been theatre: towers that clean a two-hundred-metre radius, aircraft seeding clouds that aren’t there.
This is an open notebook for the unglamorous part — measuring what’s actually happening, finding the analyses nobody has run, and working out which ambitious bets survive contact with arithmetic. Everything is reproducible from free data, and the code is public.
What Diwali does to the air
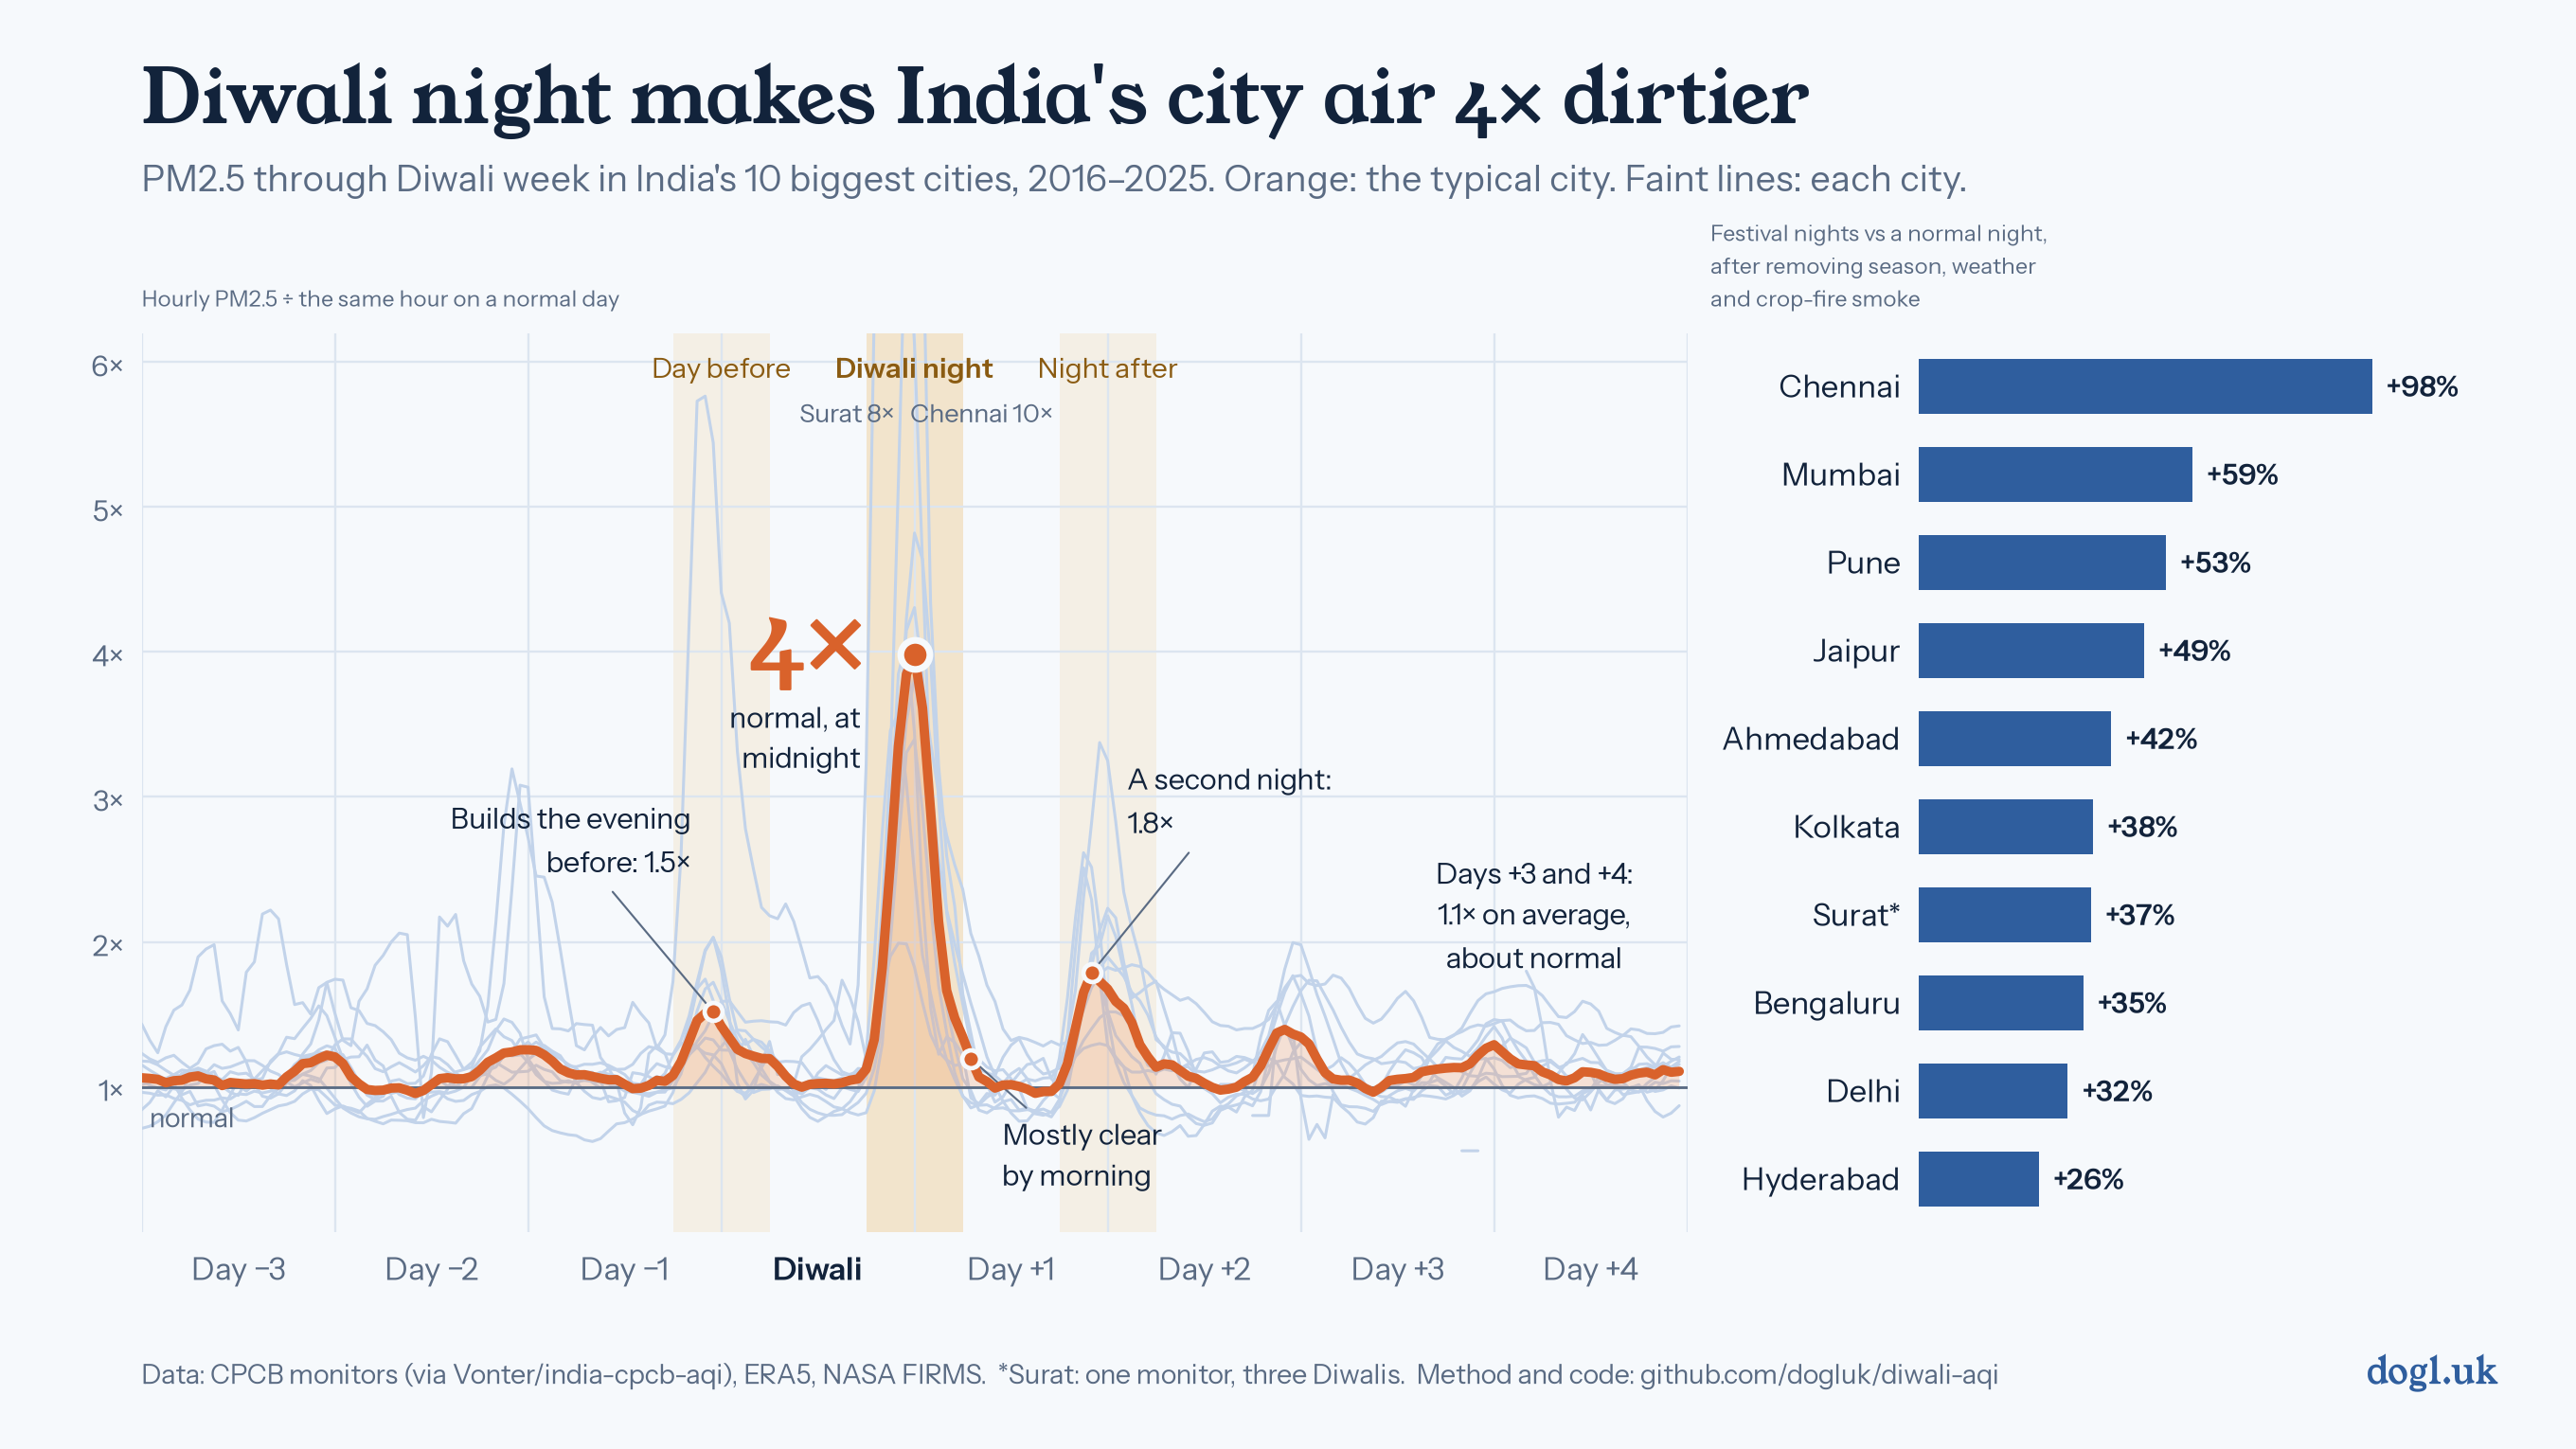
Ten years of hourly government monitor data for India’s ten largest cities, with the things that happen at the same time pulled apart: the start of winter smog season, crop-stubble smoke, and monsoon rain.
Every city has a real Diwali effect — about four times normal PM2.5 at midnight, and close to twelve times in Chennai. But the famous post-Diwali smog is mostly not Diwali. Adjusted for season, weather and fires, the week after is statistically indistinguishable from normal everywhere. What looks like a hangover is the smog season arriving on schedule.
Confounding runs in opposite directions across the country. In the north, Diwali lands as stubble burning peaks, so a naive comparison overstates it — Delhi falls from +66% to +32%. In the south, retreating monsoon rain washes the air, so a naive comparison understates it: Bengaluru rises from +19% to +35%.
There’s a twist in what people search for. Around Diwali, Indian searches for “air quality index” rise 237% and “air pollution” 36% — while searches for cough and sore throat don’t move at all. Burns rise 75%, so the method can see a real effect when one is there. Attention spikes; symptoms, at least as search reveals them, don’t.
The question behind all of it
concentration ≈ emissions ÷ (mixing height × ventilation)
Every intervention attacks one of those three terms, or else gives up on the air and protects the lungs directly. Sorting proposals by which term they touch kills most of them in a single step.
Two numbers do most of the work. Delhi’s smog weighs about 150 tonnes — the entire visible apocalypse over thirty million people is a few hundred tonnes of dust, which is why scrubbing feels tractable. And it refills in about a day. A perfect, free, instantaneous scrub of the whole city buys one clean day. That ratio kills smog towers, outdoor filtration, and most of what gets announced each November.
Winter cloud seeding fails for a reason worth stating precisely: at fifteen percent humidity, condensing every molecule of water in a kilometre-high column over Delhi yields 2.6 mm of rain. Real efficiency is a fraction of that — drizzle, which doesn’t scrub. It isn’t a technology limit. The water isn’t there.
What hasn’t been analysed
The most useful thing here may be a list of questions the data can answer that nobody has asked. Six of them, each with a confidence and a note on what would kill it — including whether firecracker bans ever worked (re-argued in the Supreme Court every autumn on almost no evidence, and answerable with a difference-in-differences across states that banned at different times), and how much monitor siting biases every Indian air quality number, including ours.
The gap analysis → · Reading list →
Work with me
This is deliberately open. If you have ground truth India lacks — hospital admissions, pharmacy sales, wastewater, ceilometer or radiosonde boundary-layer data — or you want to take one of the gaps and run it, I’d like to hear from you. Corrections especially: several of the claims here are a single analyst’s work and haven’t been through review.
Open an issue or find me.